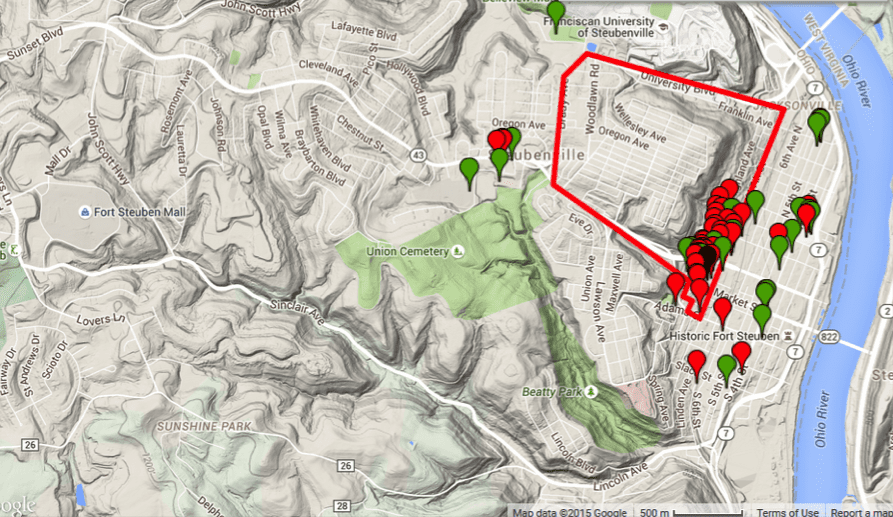
The youth’s perspective: The polygon outline is the residential census tract for the participants’ housing project community, represented by the single black marker. Green markers represent places participants identified as positive, healthy, and good, while red markers represent places identified as negative, unhealthy, and bad. Courtesy of Ryan Petteway
I remember sitting on the backs of project benches, sipping my orange drink, while listening to Mobb Deep ask “where ya from?” and discuss dropping a “gem on ’em.” I was curious. Deep thoughts ensued . . . Huh. A gem, you say? What does this gem entail, exactly? Is it expensive? Can it be sold at the pawnshop? Will it multiply if I get it wet? Is it a metaphysical, theoretical gem—perhaps something RZA would wear to a cocktail reception at the World Congress of Philosophy? Are we dealing with conceptual jewelry here? Also, what and/or where exactly is this “where” they seem to be so fascinated with? Is it a geographic where, or a cartographic where? Rectangle or square? Or perhaps a sociologic where, where people know where? And what does it mean to be “from” this “where”? So many questions, so little orange drink to answer them all.
Unbeknownst to me at the time, someone had already answered these questions. And it turns out that my personal “where” was actually a wheres! I had a census tract where, a ZIP code where, a city council district where, and a congressional district where, amongst other wheres. Everybody and their great-grandma’s niece’s neighbor’s cousin’s barber’s cat knows their ZIP code (the number at least—I bet nobody could draw it, city and urban planners aside). I vaguely remember my congressional and council districts, but drinking a pint of Ponce de León’s blood couldn’t help me reproduce those lines on a map.
I had no idea what the demographic, geographic, or topographic details of my teenage political districts were—I never saw those lines. And even though my mom earned some extra money by working for the U.S. Census Bureau on occasion, I was well into college before I knew what a census tract was. And as it turned out, census tracts were, and still are, apparently considered the Gucci briefs in a drawer full of Hanes. Let me explain.
I’m a public health researcher who focuses on the intersections of housing, community development, and health. I examine the ways in which peoples’ daily place-based experiences and exposures affect their health, and I explore the larger social, economic, and political factors that determine the spatial distribution and patterns of healthy and unhealthy exposures and opportunities. This work is commonly referred to as “neighborhood” and health research, or, as I prefer, “place” and health research.
Prior to becoming a credentialed and dissertation committee–vetted “researcher,” I served as chief epidemiologist for a major mid-Atlantic city health department. A core part of my daily work entailed gathering, analyzing, and mapping data to inform and guide programmatic and policy priorities. A key requirement for producing consistent, reliable, and comparable health data across communities is having consistent and reliable population demographic denominators (i.e., how many people of which racial or ethnic background, sex, income, age, etc.) within a defined community. And the more geographically specific the data, generally the better for planning how to use limited resources to address community health concerns. ZIP codes (despite the hype and buzz around the whole “your ZIP code is more important than your genetic code” thing within public health circles) are too large, often containing completely disparate communities, which tends to mask the existence of health inequities and analytically skew indicators. Additionally, nobody is politically or jurisdictionally responsible or accountable for ZIP codes because they often span multiple cities, counties, and even states, so data produced based on them is birdseed. And many jurisdictions don’t track or report population and housing characteristics based on city council districts. So in the city where I worked, for example, I couldn’t produce a map comparing life expectancies (not precisely, anyway) between council districts. (Note: This should alarm you because health is political.)
What I was left with then was the census tract—those little polygons created by the U.S. Census Bureau to routinely count and describe us. The city planning and health department, in collaboration with leaders from neighborhood associations, worked to spatially define each city neighborhood as a cluster of about two or three census tracts. This wasn’t something unique in this particular health department, but indeed was, and is, standard practice at many health departments. Moreover, it’s standard practice in most research on place and health—defining, measuring, and operationalizing “place” based on an imaginary line that 99 percent of people don’t even know exists. So, I mapped death rates, life expectancies, tobacco and alcohol retail densities, rodent and insect complaint rates, water and electric cut-off rates, vacant lot and building densities, and about 18.36 million other indicators at the “neighborhood” level based on these census tracts. And I thought I was killing it … until I remembered that prior to being a social epidemiologist, I listened to Mobb Deep and drank orange drink while conducting observational studies of project life.
Use this tool to view the census tracts in your area and see how they match up with your knowledge of how people interact with their place.
If I recall correctly, between middle school and high school, my housing portfolio included Section 8, Low-Income Housing Tax Credit, and HOPE VI housing. And in walking to and from school, I now know, I walked to and through no fewer than three different census tracts. On any given day between home, school, ball practice, visiting friends, going to the mall, etc., I might have been in six or seven or eight census tracts. And the funny thing is, not once do I remember walking to the end of a block and hitting my forehead on a census tract perimeter (or maybe I did and I forgot). But I do remember walking on certain blocks and being hit with racial slurs and having police pull a DJ Jazzy Jeff and Fresh Prince “Summertime” re-enactment alongside me and my boys (you know, “two miles an hour so everybody sees you . . . ”). And I do remember cherry blunts and cherry sours being sold across the street at the corner store (literally across the street, but in a different census tract), but having to go “up on the hill” a mile and a half away (in yet another census tract) to see real cherries at the supermarket. My daily “place” was actually daily places, and they weren’t defined or bounded by imaginary lines, but by real experiences and exposures that were shaped by social and economic policies, practices, and processes. Practices that “police” certain communities differently—leading to a federal consent decree to manage the local police department. Policies that limit investment in low-income communities, rendering swaths of the city so-called food deserts with little to no public transportation. And processes that displace public housing residents to refashion their homes as college dorms and exclude them from city “comprehensive plan” discussions.
So what would it have even meant for my local health department to have mapped data based on my residential census tract? How could that possibly represent my actual lived experience of place, or even begin to approximate the important health exposures and opportunities I encountered?
So I resigned. I took these particular questions into my doctorate training and returned to my former public housing community in a small, urban Rust Belt city just outside of Pittsburgh, to try and answer them through a community-based participatory research project with current residents—the People’s Social Epidemiology Project, or PSEP. The PSEP was developed and designed to democratize the place-health research and knowledge-creation process—to counter standard practices that define “place” using arbitrary and imaginary administrative bounds like census tracts. PSEP was thus envisioned as a way for residents to represent and re-present important community spaces and experiences—and to resist efforts to, in the words of one resident, “wipe us off the map.” I worked with both youth and adults, recruited as parent-child dyads, to explore how “place” shaped health opportunities and exposures within the community. “Place” for this work was based on residents’ daily mobility patterns, so as to more accurately and completely account for their entire range of place-based health experiences and exposures.
In this spirit, participants used exclusively participatory methods to map out the specific locations of their daily health experiences/exposures—that is, their place-health experiences. Residents first photo-documented, via smartphones, the important places they went to daily, like school, work, a friend’s house, or a shopping locale. Then, they used large printed maps and color-coded stickers to locate the photo-places, adding additional non-photographed places as they deemed fit. Lastly, they used a web-based community-mapping platform to integrate their data, indicating for each location whether it had a positive or negative effect on their health.
Overall, 55 percent of adult places and 51 percent of youth places were located spatially outside of their residential census tract. For youth, 80 percent of their positive, healthy, and good places were outside of their census tract, including, for example, a youth development center, a major park, and a library. In contrast, 67 percent of their negative, unhealthy, and bad places were inside, including numerous vacant lots, vacant buildings, and aspects of their own housing community (e.g. hallways, greenspaces). Among adults, 62 percent of positive, healthy, and good places were outside of their census tract (e.g. a supermarket), while negative, unhealthy, and bad places were fairly evenly distributed inside and outside.
The participatory and nonarbitrary, nonspatially bound approach of this project allowed residents to freely document the important daily places they visited. Here, residents’ mobility, and the manner in which they repeatedly cross various imaginary lines of “place” was acknowledged and duly accounted for. This not only facilitated a revelation of what could be considered some of the residents’ basic daily necessities (e.g.education, retail access, social and recreation spaces), but also where these necessities were spatially located in relation to home and how residents perceived they influenced health. Moreover, the intergenerational design of this project meant that both adult and youth perspectives were engaged. This allowed for an exploration of not only potential spatial differences between adult and youth places, but also their perceptual differences of place and its effects on health.
I doubt these findings are unique to this particular community, and indeed there is a growing body of work within public health and geography fields that suggests that accounting for the routine “breaching” of imaginary lines is in fact the real Gucci way to define and assess place. If we want to truly understand how place affects health—especially within the context of public housing and community development—we cannot simply sit at a desk and produce data that ignores the lived reality of the people whose lives we’re pretending to capture within said data. And we certainly cannot ignore the myriad ways in which place is actively made, unmade, and remade over time through deliberate and often calculated policy decisions and practice norms that determine the spatial distribution of health opportunities and risks.
Based on this work, understanding how public housing fits into the larger spatial, social, economic, and political landscape of residents’ lived place beyond the housing community boundaries is critical to evaluating and improving place-based strategies involving public housing. And a requisite for understanding residents’ lived experience with place, and consequent health effects, is explicating the mechanisms that either facilitate or limit their ability and power to participate in and influence placemaking processes. Without these commitments, it appears the increasing focus on place-based strategies within housing, community development, and public health fields will inevitably be . . . misplaced.
Consider the gem dropped.

Interesting. New ways of viewing an issue set are important. This is very smart and creative work. From my 20+ years working in “distressed” communities, I also think that zooming in even closer to home—well actually, home—is one of the most useful determinants of health and well-being. In removing lead, assessing healthy (mostly unhealthy) housing and providing weatherization in many hundreds of homes, I’ve come to conclude that rather than the “big picture”, the small picture tells us more. It also gives us access to tangible ways to affect the health and financial well-being of families—the family that lives in that home NOW, that once had a leaky roof, no insulation, lead based paint and asthma triggers in every room, and the NEXT family that will live there. While talking about placemaking and mapping is fun (we have those folks at our agency, too), if we focus on the place where people spend the most time, in the most distressed conditions, it is their home. And I can make it lead-safe, healthy, and warm for less than $12,000 in most cases. To me, that’s the best indicator of their “lived” reality.
Great article!