“Opportunity” just sounds good, doesn’t it?
Especially when used in phrases like “equal opportunity” and “fair opportunity.” It’s spy-name good— “Tunity. Oppor Tunity.” We love us some opportunity, and one area in which this has become increasingly apparent is work in support of health equity, which commonly involves housing and community development.
And here, perhaps more than anywhere else, place matters for opportunity.
Unfortunately, “place” itself seems to have gotten lost in conversations about opportunity—which is rather remarkable considering that much of what we see and hear regarding opportunity concerns its geography. Of course, place is much more than geographic space. And appreciating the true geography of opportunity requires more specificity and conceptual nuance than has been afforded by the cartographic caricatures of place produced to date. In short, we need to know which and whose geography? And what, and whose, opportunity?
To answer these questions, we must rethink our definition and measure of “place” and how it is experienced, encountered, and accessed. We must also work harder to identify and locate—both socially and spatially—the policies and practices that continue to sort people into disparate places (i.e., literal placemaking mechanisms), and present those policies and practices clearly in our measures and maps of opportunity. Without advances in these two areas, we will not be able to distinguish the contexts and consequences of (in)opportunity from the causes of opportunity.
Place, Health, and Opportunity
It’s not news that the opportunity to live a healthy life is inextricably linked to having access to a spectrum of other important opportunities. Therefore, where we live in relation to those opportunities is a fundamental factor for our health.
Many programs assert that the communities in which we live should provide the conditions and resources necessary for healthy human development—safe and affordable housing, good education and jobs, equitable transportation, access to healthy food and social services, green space and recreation. HUD efforts like Moving to Opportunity, Housing Opportunities for People Everywhere (a.k.a. HOPE VI), Promise Zones, and Choice Neighborhoods all focused on either bringing people to live nearer to opportunity or improving opportunity where people lived. Endeavors like the Harlem Children’s Zone and the California Endowment’s Building Healthy Communities initiative did the same.
Presumably, much of what we discuss in terms of opportunity in this context stems, at least in part, from the notion of “geography of opportunity,” introduced by Galster and Killen in 1995. Basically, it’s the idea that where we live affects our development and well-being throughout our life course—the precursor to the modern “place matters” frame.

At its core, geography of opportunity looks at how policies and practices have created and maintain the spatial structure of racial and economic segregation at a metropolitan level. Decisions regarding the allocation of resources (e.g., economic and social investments) followed these racial and class lines, creating a geographic landscape where opportunity is inequitably distributed—a process generally referred to by some scholars as uneven development. The effect has been that people live in certain neighborhoods not necessarily because they chose to, but largely due to decisions and policies that were made, and continue to be made, by others.
Recent work in this area has highlighted the inequality of economic, educational, and housing opportunities within and between economically and racially segregated communities. The notion of geography of opportunity is also reflected in efforts to map intergenerational mobility, such as the Opportunity Atlas, formerly called the Equality of Opportunity Project.
In my field of public health, research on place and health has made it clear that the places in which we live, learn, work, play, and age have significant and enduring impacts on our health and well-being over the course of our lives. This research has informed a growing call for and movement toward place-focused strategies for health and community development, including the Healthy Communities work from the Federal Reserve Bank of San Francisco, Health and Place-Based Initiatives from Kresge Foundation, and Healthy Communities of Opportunity work from PolicyLink, which includes the Promise Neighborhoods Institute.
Other national initiatives like NCHE’s Collaboratives for Health Equity (formerly Place Matters), and the Resilient Equitable Development work of the Convergence Partnership have continued to support and create new spaces for collaborations focused on improving elements of place.
Mapping “Opportunity,” Missing “Place”
A variety of measures and data resources have been developed over the years to help us assess and map the social, economic, environmental, and political factors that can shape health opportunity. But clicking around on these tools reveals some fundamental problems with how we think about and map opportunity. For example, as noted by Dr. Edward Goetz in his 2017 piece, much of what is passed off as opportunity mapping is nothing more than the re-mapping of poverty or racial demographics, such as mapping third-grade reading proficiency as if childhood development occurs in an unracialized vacuum unaffected by history. Goetz has also pointed out the latent racism built into many measures of opportunity, which uncritically presume that “proximity to whiteness” means greater opportunity for people of color. Moreover, much of this work has oversimplified opportunity into a spatial binary, for example, high opportunity vs. low opportunity areas, or a five-tiered gradient from very high to very low. And much opportunity mapping work has had significant limitations that undermine its validity, such as inappropriately grouping conceptually disparate indicators into single indices. For example, the Opportunity Index lumps access to health care, healthy food availability, and violent crime rate into the same “community score” index!
There is this idea that “opportunity” is just a set of positive advantages (or possibilities) that are spatially distributed in relation to where people live. But there are a few things that should concern us all about this.
First, there’s a lack of specificity about what the actual opportunities are and where and how people can access them. Most measures of opportunity would be more appropriately described as consequences of a lack of opportunity—not as opportunities themselves. An example is mapping the percentage of adult residents in an area with a college education without explaining how that data might relate to their access to education in the past, or the educational prospects of current child residents. Should we just assume that higher proportions of college-educated adults translates into more civic engagement to support investments in local elementary schools? Or is it simply that higher education = higher income = higher housing costs/property values = higher tax revenue? And how might gentrification and displacement come into play here?
Indicators like this are proxy measures at best. What is needed are measures of resources and supports that are actually available to—and being accessed by—children and youth. An adult with a Ph.D. who moves into the neighborhood with an already reading-proficient third grader a week before the census is not an indication of opportunity (especially if their arrival signals the displacement of current youth and their families)—it’s the result of an opportunity afforded and seized elsewhere.
Second, even when assets are specifically identified, there are ways in which these assets interact with and affect different groups of people that are often overlooked. For example, yes, there’s a grocery store that sells fresh produce nearby, but it’s too expensive and its presence has meant the displacement of my neighbors. Or, yes, there’s a park here, but I don’t feel welcomed when I go to it and the fields are always pre-booked by tech bros. These are components of opportunity that cannot be captured via the simplified, data-driven opportunity mapping approaches we currently have—which is not a knock, but rather an opportunity to improve.
“Place” is more than just an unchanging geographic location. Rather, it is a dynamic social and cultural creation inextricably linked to political and economic processes that unfold on various spatial levels (e.g., county, city, neighborhood). This means we need to account for how people perceive and relate to their daily social and physical environments and identify the political and economic forces that shape those environments.
For example, if the opportunity in question is access to green space and/or recreation resources as captured in some form of index, how we define “access” becomes fundamental. Every version of opportunity mapping I’ve seen makes maps based on preexisting administrative bounds—most commonly the census tract (more on this later). This presumes uniform access for everyone within this arbitrarily defined geographic location. It ignores pricing (e.g., recreation centers aren’t always free), type of resource (e.g., tennis courts vs. bike lanes vs. rock climbing vs. basketball court), travel time/costs, and social disconnections (e.g., a park in a neighborhood that may or may not welcome all)—all of which will shape who sees and accesses opportunity, and who sees and experiences exclusion. Moreover, in equating proximity to access, it ignores what is referred to as “space-time constraints” within geography—generally, external forces that have already determined an individual’s daily routines. For example, to what extent is a recreation center right next door an opportunity when it costs $35 a month, you work until 5 p.m. making $9.75/hour, have an hourlong commute, and it isn’t open at 9 p.m. after the kids are in bed?
Here, folks in the opportunity mapping business could benefit from reengaging Macintyre and colleagues’ notion of “opportunity structures”—that is, the socially and politically constructed features of communities that in their presence or absence either directly or indirectly constrain possibilities for health. To extend the previous example, to measure opportunity structures would require tracking the closing of a free community recreation center due to shifting demographics and growth of private gym facilities, or the replacement of public basketball courts with a dog park. To examine and map data on greenspace/recreation resources in the traditional manner without considering relational power dynamics of place and opportunity structures would do more to obscure inopportunity than it would to reveal opportunity.
And third, apart from perhaps PolicyMap, the existing tools discuss the spatialized nature of opportunity but don’t explain who or what has done or is doing the spatial structuring and how. Take, as a general example, the practice of reporting third-grade reading proficiency but not reporting investments in education and early childhood development, or something like a ratio of local/regional discretionary budget spent on education versus, say, policing. Or take, as a specific example, a recent study that revealed how families of color are systematically steered into communities with lower-quality built environments and schools. Would it mean very much to map “opportunity” in this context without mapping the steering?
As a broader example, the spatial structure of opportunity for much of the mapping and opportunity indexing work I’ve discussed is shaped by local community development financial institutions (CDFIs) such as SPARCC, community development entities, and programs like the Community Development Block Grant (CDBG), and the New Markets Tax Credit. Yet these forces are frequently overlooked in attempts to measure and map opportunity. Add to these mechanisms the Opportunity Zones program created via Tax Cuts and Jobs Act of 2017 and you have quite a recipe for placemaking (and/or breaking/unmaking, remaking)—one that would appear integral to understanding spatial inequalities in opportunity.
Toward Re-Placing the Geography of Our Opportunity Maps
The above considerations withstanding, I have an even more basic concern with the idea of mapping opportunity: How are we defining the geographic boundaries of the places, and why? The concept of geography of opportunity is anchored in the notion of “neighborhoods” (e.g., “high-opportunity” vs. “low-opportunity” neighborhoods), which are routinely (though not always) defined by researchers as a set of census tracts. Thus, efforts to describe the geography of opportunity have relied almost exclusively on data collected, aggregated, and analyzed based on administrative bounds which most folks don’t even know exist.
As I noted in a previous piece, measures of place—such as opportunity or health—that are based on this definition of “neighborhood” ignore the spatial realities of where people routinely spend their time—their activity spaces. People are mobile and often move to and through multiple census tracts (“neighborhoods”) on a daily basis to meet their needs, resulting in a spatial “place” and opportunity footprint that bears little to no resemblance to fixed administrative boundaries. This raises conceptual and empirical challenges in assessing the spatial dimensions of access/exposure to opportunity, especially if we presume that opportunity being near to where someone lives (and specifically in their residential census tract) is most important.
For example, in the context of (urban) healthy food access, “low opportunity” is roughly defined as living in a low-income census tract with low household vehicle access and being more than a mile away from a healthy retail location. Are we to assume that a person in a “low-opportunity neighborhood” does not have access to healthy food because there’s not a retailer within a mile of home? What if they work 9 miles away and shop at healthy food retailer next to their place of work on the way home? What if their mosque is 12 miles away and it hosts a farmers’ market where they routinely buy their fresh produce?
Traditional opportunity mapping completely ignores the critical importance of people’s activity spaces in shaping their exposure/access to various opportunities. For this reason alone, the arbitrariness of most geographic boundaries used in standard opportunity mapping practice is highly questionable.
By not anchoring measures of opportunity in people’s lived experiences of place—and by failing to explicitly identify historic and current mechanisms that systemically structure their routine place-based activity patterns—we are essentially, and ironically, de-placing our maps of opportunity. We are stripping away context and obscuring accountability, producing mere polygons that position places as problems, not as the results of problematic policies/practices that curb potential and preclude possibility.
Certainly, on some level, the sheer magnitude of economic and racial residential segregation in many metropolitan areas dampens the necessity for more precise measures of opportunity access/exposure, but I see this as a true opportunity for big data, citizen science, and crowdsourcing intersections. If the spatial narrative of opportunity is being told based on maps of indicators/data that don’t truly capture people’s lived experience of place-based opportunities, aren’t we misrepresenting the geography of opportunity? Are we doing justice to our stories of opportunity? And, most importantly, could we dream up and develop better solutions by contextualizing lived geographies of opportunity in our actual lived experiences of place? In short, is there value to inserting people’s lived experiences of place into assessments of and data narratives surrounding the geography of opportunity?
Participatory “Geographies of Embodiment”—A Model for Re-Placing Maps of Opportunity?
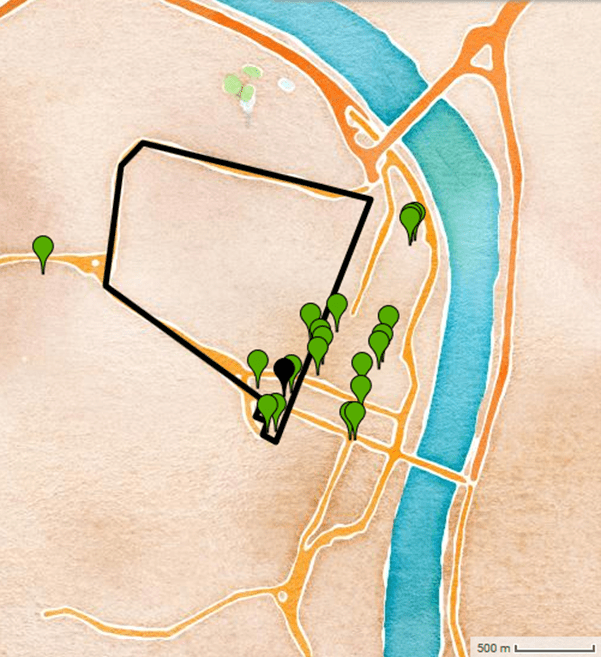
Here, I want to introduce the notion of “geographies of embodiment” in relation to the “geography of opportunity.” The idea of embodiment relates to the ways that our daily social and physical environmental exposures “get under our skin” to affect our bodies physiologically; thus, geographies of embodiment concern what our bodies experience in different spaces. The concept comes from one of my recent research projects that examined place, embodiment, and health among public housing residents. The overall goal of this work was to explore the spatial structure of youth and adult participants’ daily health exposures, experiences, and opportunities by mapping out important locations. First, a participant would identify and map out places they believed had positive or negative effects on their health. Then they would complete a mapping worksheet for each place, using color-coded stickers to indicate which areas of their body were affected and how (positively, negatively, both). They used X-Ray Mapping and a multimedia-enabled web-based mapping platform to map their “geographies of embodiment.” This method allowed participants to describe how their daily places affect their bodies/health.
Figures 1 and 2 show the spatial distribution of positive and negative place-embodiment locations for adults and youth. Aggregate results revealed that 49 percent of youth place-embodiment locations were outside of their residential census tract—with 75 percent of positive place-embodiment locations outside, and 66 percent of negative place-embodiment locations inside. Overall, 67 percent of youth and adult positive place-embodiment locations were outside of their residential census tract but were still relatively close to their residence. In an opportunity mapping context, traditional approaches would suggest a neighborhood with very few assets or positive attributes—and would have missed 67 percent of what residents experienced and identified as an opportunity.
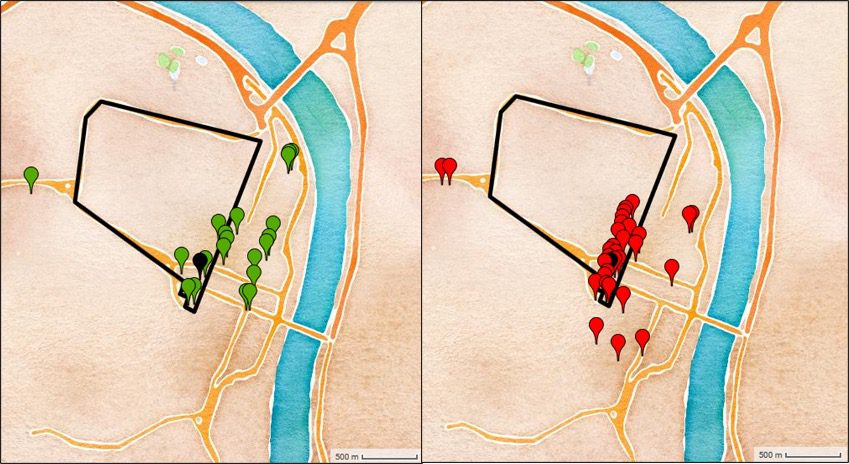
FIGURE 1: Youth Geography of Embodiment. Positive Place-Embodiment (Left) and Negative Place-Embodiment (Right).
Youth reported perceptions of place-embodiment for specific locations they encounter. Green Markers represent locations youth perceived as having a positive body-effect, while represent Red Markers represent the opposite. The black polygon is an outline of the census tract in which the participants’ housing community is located. The Black Marker is their housing location.
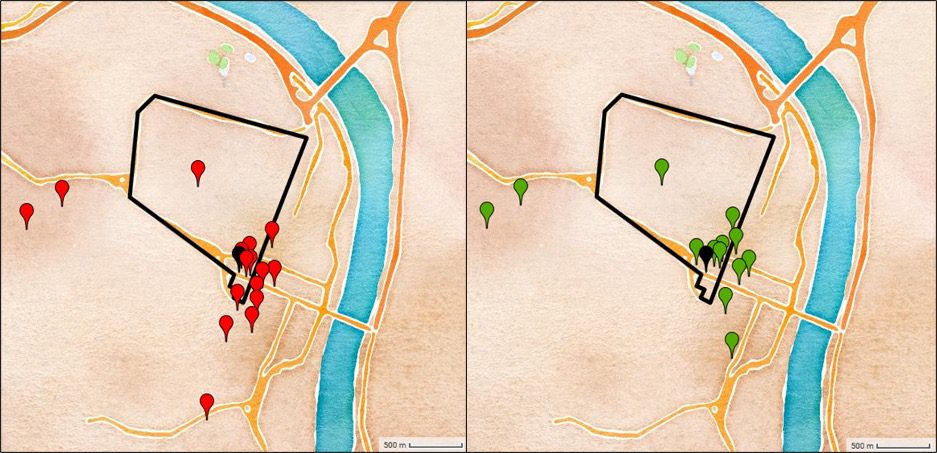
FIGURE 2 Adult Geography of Embodiment. Positive Place-Embodiment (Left) and Negative Place-Embodiment (Right).
Adult reported perceptions of place-embodiment for specific locations they encounter. Green Markers represent locations adults perceived as having a positive body-effect, while represent Red Markers represent the opposite. The black polygon is an outline of the census tract in which the participants’ housing community is located. The Black Marker is their housing location.
Through mapping “geographies of embodiment” via participatory methods like X-Ray Mapping, we can gain greater insight into how place affects health. This could improve the development of quantitative health metrics based on place and enhance efforts to uncover elements of local/regional social, political, and economic contexts that generate and preserve spatial inequality. More generally, I see the geographies of embodiment concept—specifically the participatory and spatially dynamic aspects underlying it—as being able to extend and enhance geography of opportunity thinking, and improve the use, analytic value, and actionability of tools like the Child Opportunity Index or HUD’s Health Communities Assessment Tool (HCAT). Why not pursue a more inclusive, democratic definition of residents’ “place” by taking advantage of accessible and low-cost technologies like smartphones and web-based mapping platforms? Acknowledging and facilitating residents’ agency and collective power to pursue collaborative practices would do procedural, epistemic, and analytic justice to opportunity mapping, and would anchor the results in the lived realities of those actually searching for opportunity. This can render a more humanized and actionable data narrative, while simultaneously structuring meaningful opportunities for civic engagement and expanding mechanisms for public accountability
And why not make this approach a part of standard planning, community development, and public health practice?
Existing tools and platforms have been and will continue to be valuable in our collective efforts to map opportunity and intervene on spatial inequities. Creating a place for participatory community-generated data can further this agenda.
Indeed, Kirwan Institute, one of the early leaders in opportunity mapping, suggested the importance of participatory research in its Opportunity Communities Model. The Regional Equity Atlas, through their Equity Stories program, and PolicyMap, through enabling users to upload their own data to create new/enhance existing maps, might be on the right track (especially with the addition of the new Opportunity Atlas data).
It seems that ultimately, the geography of health opportunity is a result of social and economic opportunities determined by political processes and power arrangements. In other words, healthy inclusive governance is a prerequisite for health opportunity. Here, I wonder: Shouldn’t we have measures that capture a single-parent’s ability to attend a workday-afternoon city planning meeting that will determine the fate of affordable housing in their city? Or measures that reflect the extent to which local CDFIs work with community residents to define, assess, and respond to opportunity concerns? Shouldn’t we be able to measure how equitably local CDBG funds have been spent? Or know local politicians’ “equity voting” scores (e.g., ratio of pro-affordable housing policy votes to policy votes detrimental to affordable housing)? While we’re out here mapping spatial distributions of poverty and the percent of third graders who can read, plans are being crafted and decisions are being made about which of our communities is (singular, because we’re not all getting it) worthy of opportunity investment. Literally. So is it possible that we’re not—but should be—mapping the causes of opportunity?
Opportunity goddamn.
10 Tools to Explore Spatial Dimensions of Health Opportunity500 Cities Project (CDC, RWJF, CDC Foundation) |
The very granular participatory mapping described here is is a great complement to opportunity mapping. Pioneered by john powell when he was at the Kirwan Institute, opportunity mapping is a tool to visualize the geography and structures of opportunity — and inopportunity — at a regional level. Not as a way to measure “proximitity to whiteness,” but as a way to show both the causes & effects of segregation, as well as for targeting a range of remedies. Since its inception, opportunity mapping has been utilized to graphically vizualize the racialized maldistribution of opportunity caused by discriminatory government policies and investment/disinvestment that did not previously exist.the
With ever advancing GIS technology and imagination, we can and should continue to refine opportunity mapping and to develop new and more granular tools to supplement the wide angle regional lens it provides. But there is no need to denigrate the aims, important contributions or continued usefulness of opportunity mapping.