The belief that households should not spend more than 30 percent of their income on housing has been a foundation of U.S. housing policy for more than three decades. Households that spend more than this level are typically defined as “cost burdened.” (Those that spend more than 50 percent are deemed “severely cost burdened.”) Twenty-one million renter households, representing almost half of the U.S. rental market, experience this burden.
Measuring the housing cost-to-income ratio has its merits. The ratio can be calculated with readily available data and relative ease. It can be a way to describe and compare housing affordability across households. We can use it to compare the prevalence of housing affordability challenges among low-income households as compared to higher-income households, and to determine whether affordability problems have increased or decreased over time.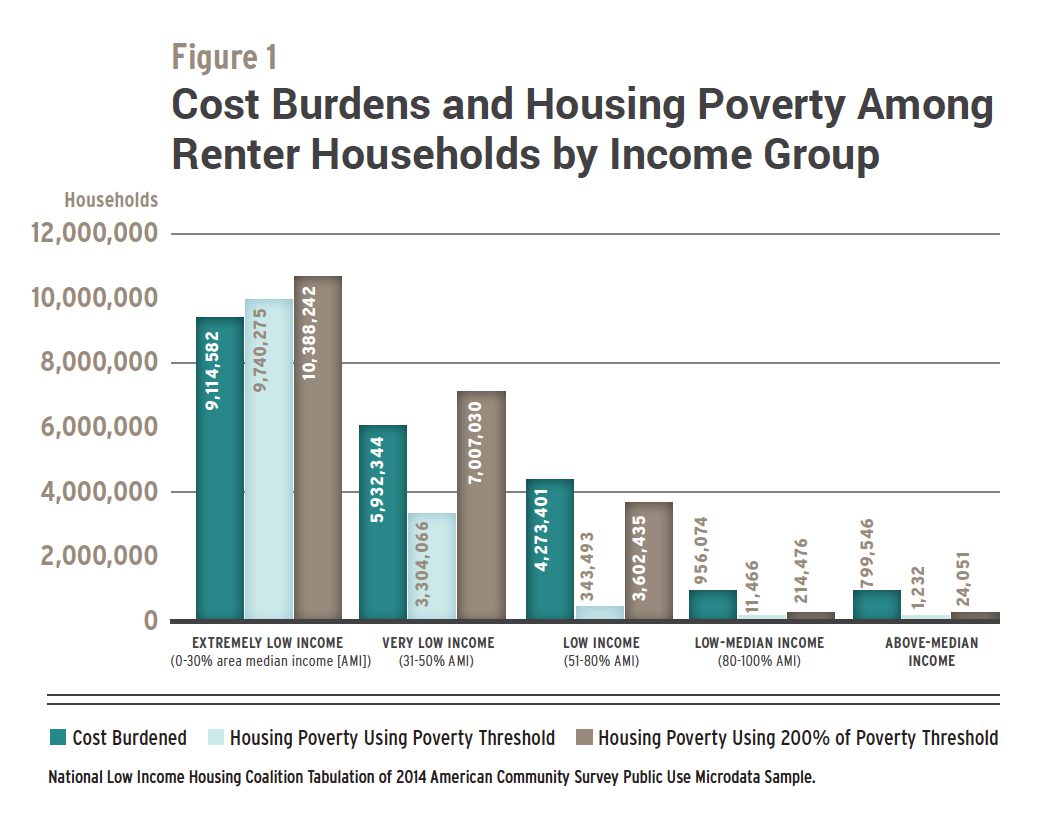
As a tool to measure housing needs and inform policy, however, relying on the cost-to-income ratio can lead to faulty conclusions about how and for whom we should invest scarce public resources for housing.
For example, the fact that cost burdens are increasingly found among renters across all income levels is often cited these days as a reason to use public dollars to reduce housing costs and create affordable housing opportunities for a broad range of incomes, including moderate- and middle-income households.
However, other ways of measuring housing need provide a different picture.
Problems With the Cost-to-Income Ratio
A uniform housing cost-to-income ratio ignores the different financial capabilities among families of varying incomes, sizes, and types.
A median-income family may be able to afford housing costs greater than 30 percent of their income without sacrificing other basic necessities, while a low-income family of the same size might need housing costs well below 30 percent of income to avoid such sacrifices.
For example, the Economic Policy Institute’s Basic Family Budget Calculator for one working parent and two children living in Orlando, Florida, includes monthly expenses of $584 for the USDA’s low-cost food plan, $480 for transportation, $486 for health care, and $757 for other necessities, such as personal care, household supplies, and educational materials. The median family income, adjusted for family size as the Department for Housing and Urban Development would do, for the Orlando metro area was $53,708 in 2015, so a median-income parent with two children could afford to spend more than one-third of his or her income on housing and still meet these other expenses. An extremely low-income parent, however, making less than 30 percent of the area median income ($15,323), would have nothing left for housing if these other expenses were paid first, even if they received food assistance from the Supplemental Nutrition Assistance Program and the Earned Income Tax Credit.
Similarly, a couple without children can afford to spend more on housing than a couple with the same income, but with two children.
Other Ways to Measure Housing Need
Forty years ago, Cushing Dolbeare, founder of the National Low Income Housing Coalition (NLIHC), suggested an alternative to the standard housing cost-to-income ratio. She proposed a “residual-income” approach, where the amount poor households could afford to pay for housing was determined by what they had left after meeting other basic needs. Different researchers have developed this idea further, using differing approaches to calculate what constitutes “meeting other basic needs.”
Michael E. Stone, the late housing advocate and scholar, was a prominent advocate of a residual-income measure of housing affordability that he called “shelter poverty.” Stone’s approach is arguably the most well-known alternative to the 30 percent housing cost-to-income standard of affordability. Stone calculated the cost of a minimally adequate standard of living, excluding housing, from the U.S. Bureau of Labor Statistics’ (BLS) lower budget. BLS developed the budget in the 1960s as part of a series of family budgets based on expenditure data and expert opinion of what constituted a modest standard of living. The series included a lower, intermediate, and higher budget. The budget Stone used included such necessities as food, transportation, medical care, clothing, household furnishings, and other goods and services. Using those figures, Stone created a sliding scale—based on household income, size, and, to a limited extent, geography—of percentages of income that a household could spend on housing without sacrificing other basic necessities. (BLS updated its family budgets with the Consumer Price Index [CPI] until it discontinued them in 1983. Stone continued to update the budgets using the CPI for a number of years.)
The fact that close to half of all U.S. renters are cost burdened is a rallying cry for greater investments in affordable housing.
Stone called households that were unable to cover the cost of basic necessities after paying for their housing “shelter poor.” He found that low-income families of three or more people were more likely to experience shelter poverty than cost burden because their other costs were higher and thus they could afford to spend less on housing than the standard 30 percent of income.
Nandinee Kutty, an economist and policy consultant, used a similar residual-income approach in 2005, but with the cost of minimal non-housing needs set at two-thirds of the official poverty threshold, far more conservative than the BLS budget. The poverty threshold was set at three times the cost of a basic food diet in 1963, and is updated annually for inflation using the CPI. Critics of this approach contend that the poverty threshold is too low to represent an adequate standard of living. When the threshold was developed, food accounted for approximately one-third of the typical household’s budget. The typical household budget today has a greater share of non-food expenses, indicating the multiplier should be higher than three. The poverty threshold is adjusted for household size, but not for geography; another criticism of the measure. Non-housing necessities, however, are a less significant driver of varying costs of living across places than housing.
Kutty identified households that did not have two-thirds of the poverty threshold left after paying for housing as living in housing poverty.
A central challenge of the residual-income approach is defining “basic needs.” The BLS family budgets, used by Stone, were discontinued 30 years ago. A potential replacement is the Economic Policy Institute’s family budget, which estimates how much income a family needs for a “modest, yet adequate” standard of life. The budget is an important tool that highlights the cost of significant family expenses, including food, child care, transportation, health care, and other necessities, in more than 600 local areas. Too many families don’t have adequate income to meet these costs. The budget, however, assumes urban families use full-time center-based child care and that households use their own car for all non-leisure transportation, potentially overestimating the cost of “basic needs.”
Using the poverty threshold to determine who is living in housing poverty is the most conservative estimate of who is in critical need of housing assistance, an important consideration given the limited federal budget for housing programs. The poverty threshold is the official U.S. definition of income inadequacy, an income below which a household cannot afford the most basic needs of subsistence. A middle ground between these two definitions of “basic needs” may be appropriate—a middle ground that preferably could be measured nationally and with ease.
What Better Measures Mean for Policy
Households that cannot meet their basic needs after paying for housing clearly have the most critical need for housing assistance. Matthew Desmond, author of Evicted, reminds us that, “The rent eats first.” Kids often go without adequate food when their parents must cut other expenses to pay for shelter. Scarce public resources should be targeted to these most vulnerable households.
Housing poverty, Kutty’s measure, is more concentrated among the lowest-income renters than cost burdens (as measured by the traditional 30 percent standard) are. More than 9.1 million extremely low-income renter households (those that earn less than 30 percent of the area median income, or AMI) spend more than 30 percent of their income on housing (Figure 1). And yet 9.7 million live in housing poverty, approximately 625,000 of which do not spend more than 30 percent of their income on housing.
In contrast, slightly more than 6 million renter households with incomes greater than 50 percent of AMI (the highest three income groups in Figure 1) are considered cost burdened by our traditional 30 percent standard. These households face challenges, but fewer than 357,000 of them live in housing poverty. Very few households with incomes above 80 percent of AMI live in housing poverty.
A more generous definition of “basic needs” has little impact on the measure of housing poverty among extremely low-income households, but causes significant amounts of housing poverty to spread higher up the income ladder. When we use 200 percent of the poverty threshold (which is commonly used) to measure housing poverty, the number of very low-income renter households (31 to 50 percent of AMI) in housing poverty increases from 3.3 million to 7 million, surpassing the 5.9 million households in that income group that are cost burdened. The number of renter households with incomes between 51 and 80 percent of AMI living in housing poverty increases to 3.6 million, and the number for those between 81 and 100 percent of AMI rises to 214,000—in both cases still fewer than the number of those households that are cost-burdened.
Legislation to use precious federal housing resources to serve middle-income households, such as the proposed Middle-Income Housing Tax Credit to assist renters up to 100 percent of AMI, would not reach renters living in housing poverty, though they have the most critical and urgent need. Developers would be able to use the credit to produce housing priced for households up to 100 percent AMI, making the units unaffordable to extremely low and very low-income renters without additional housing assistance.
The concentration of housing poverty among extremely low and very low-income households implies that policy should prioritize programs that directly serve those households, such as the national Housing Trust Fund, vouchers, and public housing. NLIHC also supports legislation that improves the Low-Income Housing Tax Credit (LIHTC) program to better serve extremely low-income renters. These improvements include a 50 percent basis boost for tax credits if 20 percent of a development’s housing units serve extremely low-income renters as well as income averaging, which would allow a development to use tax credits to serve households with income up to 80 percent of AMI, as long as other units serve households with income below 30 percent of AMI.
There is an opportunity in the current discussions about mortgage interest deduction (MID) reform to shift resources to those who need it most. Modest changes to the MID, which include lowering the amount of mortgage eligible for the deduction and converting the deduction to a tax credit, would save $241 billion over 10 years, which could be invested in housing for households with critical needs. (It would also provide a great number of additional homeowners who don’t currently benefit from MID with a tax benefit from their mortgage interest.)
The fact that close to half of all U.S. renters are cost burdened is a good rallying cry for greater investments in affordable housing, but we must recognize that our current standard of determining whether a household is cost burdened treats all households equally, despite their varying abilities to pay the rent.
Cost burdens are an appropriate indicator of affordability for different households, but as a tool for developing policy, they can be misleading. They understate the affordable housing need among the lowest-income renters and overstate the need for other households. This point is vital to keep in mind when we decide how to invest public resources for housing.


Comments