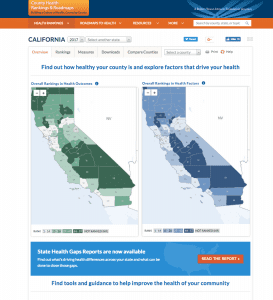
An example of the County Health Rankings and Roadmap tool for the state of California.
Within the last five years, partnerships between community development and health organizations have grown from one-off local experiments to a full-blown national movement. Community development corporations (CDCs) are working alongside hospitals and public health departments to holistically revitalize communities in need. Hospitals are pooling community benefit allocations and health insurers are providing loans for the development of supportive housing with on-site health services. Community development financial institutions are serving as investment vehicles and strategic partners for mission-oriented health care systems.
And the list goes on and on. Indeed, these partnerships are becoming more the norm and less the exception, but how do we know that they are actually having a good effect on health, well-being, and economic opportunity? What indicators are most powerful for showing the health-related returns of community development? Where does a community developer even begin in thinking about measurement?
Field leaders agree that answering these questions is critical to sustaining and targeting investments in holistic community development efforts and supporting the partnerships that make them happen. Thankfully, there are numerous resources designed for this purpose. This includes mapping tools, indices, data sources, systems for pooling health and socioeconomic data, and technical assistance networks to support outcome evaluations.Here is a snapshot of the kinds of resources that can help you meet your measurement needs.
Map existing conditions
Thanks to the newest technology, maps and mapping tools are widely used to help make place-based data interactive and visually compelling. For those working at the intersection of community development and health, a number of mapping programs are helpful in understanding what is happening in a community before, during, and after a project.
- Community Commons is an interactive tool that brings together thousands of databases to document community assets and opportunities as they relate to equity, economics, education, environment, food, and health. Once you create a free account, you can check out maps made by others and upload your own records to complement the vast data already available on the site. The site is particularly useful for accessing the latest census-tract–level health data from the 500 Cities Project, an initiative of the Robert Wood Johnson Foundation, the Centers for Disease Control and Prevention (the other “CDC”), and the CDC Foundation.
- PolicyMap is an interactive tool developed by The Reinvestment Fund that uses GIS data to generate maps for research, market studies, business planning, site selection, grant applications, and impact analysis. The tool includes free and subscription-based features that juxtapose health data (also drawing from 500 Cities data) with demographic, real estate, and other data.
- County Health Rankings and Roadmaps (CHR&R) is a Robert Wood Johnson Foundation-funded program of the University of Wisconsin Population Health Institute that includes a comprehensive online tool and technical assistance network to measure health outcomes and plan courses of action. The program’s visual powerful ranking tool compares the factors that influence health across U.S. counties. Public health departments widely use these rankings to plan programs, but the rankings can also complement census-tract-level analyses by providing a county-level view of health.
Drill down into specific social determinants
Once you’ve explored the existing conditions in a community, there are a number of tools that make sense of the data out there so you can dig deeper into the social determinants of health you want to focus on. Many of these tools were developed with educators, policy advocates, and/or hospitals and health care systems in mind, but they can help community developers understand how their work overlaps with that of health and other sectors.
-

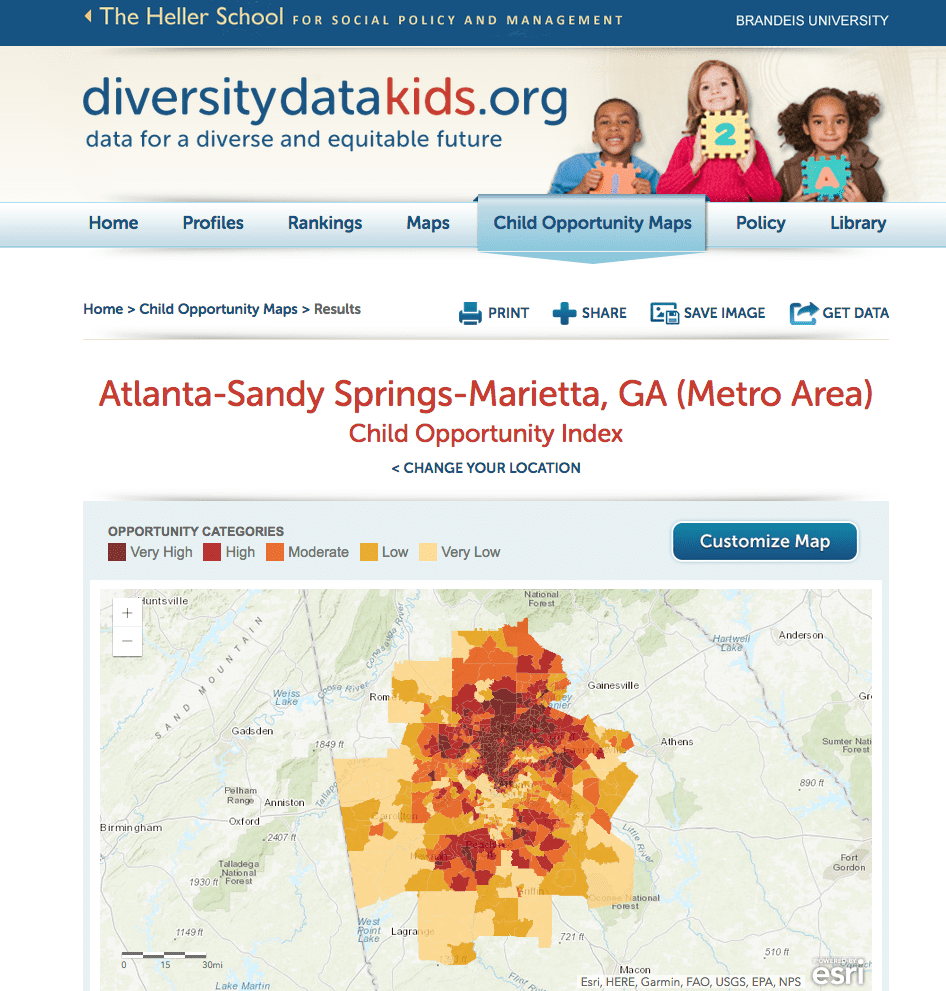
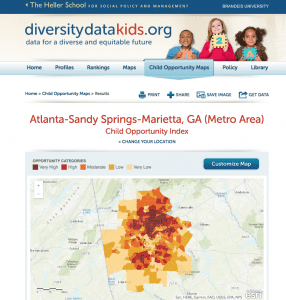
An example of the Child Opportunity Index applied to the Atlanta region.
The Child Opportunity Index is a project of the Kirwan Institute and the Brandeis University Heller School for Social Policy and Management that can help you visualize how neighborhood conditions influence child health and development in the 100 largest U.S. cities. Create maps and charts, rank metropolitan areas in your region, and explore differences in child opportunities according to race and ethnicity down to the school-district level.
- The National Equity Atlas is a tool developed by PolicyLink and the University of Southern California’s Program for Environmental and Regional Equity to explore changing demographics, racial inclusion, and the economic benefits of equity for the largest 100 cities, largest 150 regions, all 50 states, and the U.S. as a whole. Particularly relevant to community developers are the site’s stories about how communities are using equity data to drive change and its “equity profiles” for over a dozen major metropolitan areas across the U.S.
Plan new projects and track outcomes
While the above tools are particularly helpful in thinking about the larger context in which specific community development projects are located, there are now tools designed to assist community developers who are working at the project level. These tools can help track a project’s impact over time from concept to implementation and can serve as powerful case-making tools for fundraising and policy advocacy.
- Metrics for Healthy Communities is an online tool developed by Wilder Research and the Federal Reserve Bank of Minneapolis that offers a series of logic models linked to data to help guide and measure the results of comprehensive community development, specifically affordable housing, child care centers, food access projects, physical activity programs, and supportive housing. The logic models can help you define project goals and connect them to specific activities, outputs and short-, medium-, and long-term goals around health and well-being.

An example of the Child Opportunity Index applied to the Atlanta region.
- Opportunity360 is a comprehensive resource developed by Enterprise Community Partners to help practitioners develop strategies for increasing opportunities in neighborhoods, identifying cross-sector partners, and determining impact of a specific project or portfolio of projects. Opportunity360’s measurement reports, which incorporate PolicyMap’s interface, are particularly powerful for quickly demonstrating a neighborhood’s assets and challenges down to the census-tract level, using over 200 data indicators from public and proprietary sources.
- The Social Impact Calculator, developed by the Low Income Investment Fund, quantifies the social value of community development projects with a focus on affordable housing, early childhood education, and health clinics. The calculator uses existing research to help estimate social benefits and is particularly helpful when you have project data readily available (e.g., the number of low-income housing units, high school graduation rates, etc.).
Collect data to enrich your story of impact
All of the tools in this list rely on existing public and proprietary data sources, which can provide a comprehensive picture of what is happening in a community, how it fares based on specific social determinants of health, and how new projects might be planned and tracked over time. But any measurement strategy is incomplete without a deeper look into the lives and patterns of residents living in those communities. This is where data collection and outcome evaluation resources come in.
- Success Measures is an evaluation resource based at NeighborWorks America that has developed a set of tools to help funders and community developers document the health-related outcomes of a wide range of comprehensive community development projects including affordable housing, workforce development programs, supportive services, and community engagement initiatives. Success Measures’ Health Tools, released in December 2017, includes 65 tools spanning surveys, interview guides, observation protocols, and templates to collect data in a wide range of settings.
- Data Across Sectors for Health, a national program of the Robert Wood Johnson Foundation, provides grants to regional health departments, community-based organizations, and others to support collaborative data-sharing projects to improve health. Of particular relevance to community developers is All-In: Data for Community Health, an online peer network to help organizations share what they’ve learned and best practices on cross-sector data sharing. You can .
- Stewards for Affordable Housing for Future’s (SAHF) outcomes measures is a framework for evaluating the value of combining social services with affordable housing. While SAHF specifically uses the outcomes measures to track the social impact of its rental properties, it provides a useful framework for thinking through what metrics and types of information would be most useful in making the case more broadly for investments in service-enriched housing.
- The Adult Well-Being Assessment, developed by 100 Million Healthier Lives, is a 14-question, field-tested survey that can be used to measure individual well-being in adults. It can be a useful tool to complement the outcome measures mentioned above to understand how neighborhood conditions might shape individuals’ perceptions of their own health and well-being.
One Stop
In its role as a capacity builder for partnerships involving the community development and health sectors, the Build Healthy Places Network created MeasureUp, a curated online portal of tools for measuring the health value of community development. All of the tools mentioned above can be found there. We’ve learned that there are resources that are appropriate to practitioners wherever they are in the process, be it planning a new project or evaluating impacts after a project is complete. Already, community developers are making use of these and other tools in a number of ways.
For example, Success Measures and Enterprise Community Partners jointly launched the Health Outcomes Demonstration Project in January 2017, which is helping 20 community development organizations measure the health outcomes of their work through grant support, technical assistance, peer learning opportunities, and access to the new Success Measures tools. The tools are helping organizations evaluate a wide range of community development efforts in varying stages of implementation spanning affordable housing, resident services, healthy eating, and financial capability. Among the 20 organizations participating in the project are:
- Chicanos Por La Causa, a Phoenix-based CDC that is evaluating how stable housing, nutrition, and exercise influence the health outcomes of low-income, multiracial seniors served by its Casa Primavera Senior Center.
- NeighborWorks Western Vermont, which is evaluating whether physical improvements to homes result in improved health outcomes for patients whose conditions are triggered or caused by environmental rather than genetic issues.
- Chicago-based Claretian Associates, which is evaluating the effectiveness of its affordable housing and supportive services, currently serving 97 families that comprise all ages, from children to senior citizens. By gaining a better insight into the health of the community, Claretian hopes to improve services and find the most effective way to help residents live a healthy life.
These types of measurement efforts are useful models for community developers and can be further amplified with the many other tools available. The Build Healthy Places Network has already brought national metrics experts together to strategize what this could look like, but clearly there is more exploration to be done.
There is no one set of tools that can tell a complete story of impact. And even with sophisticated data and tools, it’s critical that resident engagement be part of the process of not just planning and implementing projects, but also in measuring their impacts. Additionally, as the health care sector continues to deepen its connections with community development, it will be more important than ever to leverage new health partners both in cross-sector initiatives and in the measurement of their impacts.
But the first step is knowing what resources you have and how you can use them. As the examples above illustrate, you don’t have to be a data wonk to make use of the measurement resources out there to tell the story of your project’s impacts to partners, investors, and the communities where you work.

Comments