“We are always trying to understand the state of the CDC field,” says Mark Kudlowitz, senior policy director from LISC, a national intermediary organization that works with community-based development organizations. “It’s been difficult, sometimes to advance resource provision in the absence of data.”
The National Congress for Community Economic Development (NCCED), an industry trade group that ceased operations in 2008, produced five different “census” reports of the community development field, based on extensive surveys, between 1988 and 2005, but there’s been nothing equivalent since.
To fill that need, last year the National Alliance of Community Economic Development Associations (NACEDA) launched Grounding Values—an ambitious three-year research project to bring our understanding of the state of community-based development organizations up to date. Working with Urban Institute as the research partner, the project has an advisory group with representatives from most of the major national networks and intermediaries in the field. (Disclosure: I participated in this advisory group. This article, while it interviews members, was produced independently of NACEDA and the advisory group.)
The first phase of the project, whose results were published on Aug. 31 and released at a virtual NACEDA summit on Sept. 15, is a review of the financial health of CBDOs based on IRS form 990 data, primarily from 2018 but also in select years from 2001 to 2019, to examine changes over time. Relying on IRS data limits the kinds of information you can get significantly, but it lets the researchers include many more organizations, including some that closed their doors in that time period.
The second stage will be based on another survey—covering similar questions to past censuses for comparison’s sake, but also including updated ones. (Eligible organizations should have already received a survey link from Urban Institute. Surveys are due Oct. 21.)
Key Findings
The financial health report based on tax data shows that the field has proven resilient and continued to grow—but that that growth is tenuous, with financial margins shrinking and many of the smaller organizations, which often serve the areas most in need, facing significant financial challenges. And that’s all before the pandemic, since the report only looked at data through 2018.
The Urban Institute report gives very broad information about where CBDOs are getting their revenue from (earned income versus donations, nothing more specific), their assets and liabilities, and what their financial health looks like. It provides comparisons across larger and smaller organizations and between regions of the country; regional and state-level fact sheets are available for deeper dives.
The report identified 5,720 organizations that met the researchers’ criteria to be a CBDO. Despite many challenges, including the Great Recession, the CBDO sector as a whole has grown steadily in revenues and assets over time, though not as rapidly as it did in the 1990s. There was a small increase in CBDO closures in the years after the Great Recession and an even smaller one around 2017. It’s possible that many of recorded closures were actually the result of mergers, rather than failures.
However, though the field is growing, the picture of its financial health shows that many organizations are experiencing financial stress—operating margins and net incomes are declining, on average. A third of CBDOs experienced a shortage of months of cash on hand and 16 percent reported insolvency in 2018. Insolvency rates have increased modestly from 10 percent in 2001, but they also fell back to 13 percent in 2019.
Geography
Looking at the four major census regions, organizations in the West are sparser, larger, and more financially robust than the rest of the country. “In the Western United States, we have larger units of local government, typically,” notes Kudlowitz of LISC, and the population tends to be more dispersed, and so the organizations tend to be larger to cover those larger areas. The fact of their being more financially robust is likely correlated with their being larger.
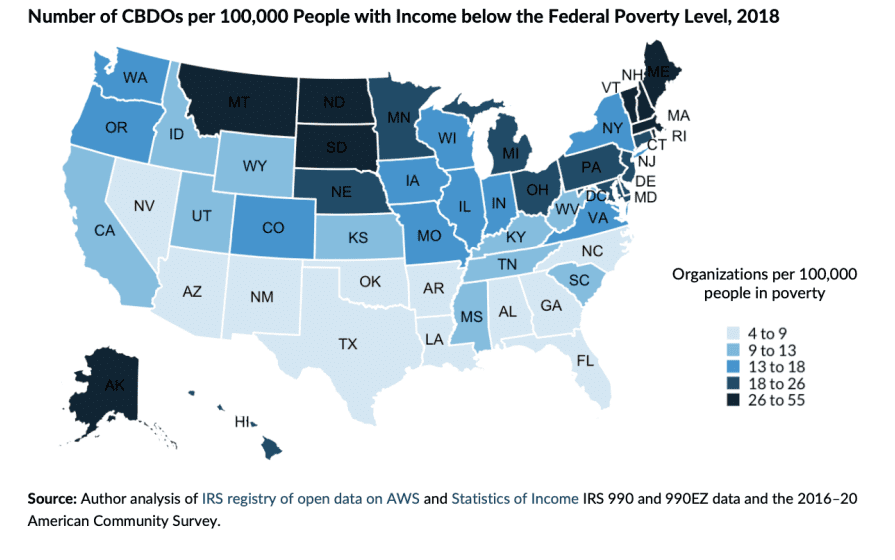
CBDOs in the South are more plentiful, generally smaller, and have higher levels of cash but fewer leveraged assets. The number of CBDOs relative to the number of people living below the federal poverty level is also lowest in the South, though the total number is highest. If you look at the whole country, rather than dividing by the four major census regions, there is actually a clear band of states across the Deep South and Southwest that have notably fewer CBDOs per population in poverty than the rest of the country.
“The Southeast is where the highest and most persistent incidence of poverty exists,” says David Lipsetz, president and CEO of the Housing Assistance Council, which works on rural affordable housing issues. The southeast has more “kitchen table nonprofits” he says, meaning extremely small, often volunteer-run organizations that might meet around someone’s kitchen table. And “There’s nothing about the way the affordable housing world works that makes it easy for them. . . . We think about high capacity based on past success, and that past success was built on the structural inequities of our programs.” He gives as an example the guaranteed CDBG funding that goes to larger urban areas, while “the smallest organization with no grant writer and the least amount of capacity has to go to the state and compete” for some of the rest of the funding, making it very hard to hire staff or launch programs that require consistent year-over-year resources.
Size Skewing
The differences between smaller and larger organizations were perhaps some of the most notable findings. The researchers found that a disproportionate amount of the sector’s resources is concentrated in a few of the larger organizations, and those larger organizations tend to be more stable financially. Smaller CBDOs own fewer assets than large CBDOs and are more likely than larger organizations to experience negative net income, financial disruptions, and insolvency.
The size categories the report uses are small, mid-small, mid-large, and large, which were created by dividing the total number of organizations into evenly populated quartiles by total expenses. About 50 percent of the “small category” were entirely volunteer-run, and that category might also have included some organizations that were functionally no longer in operation.
Chris Walker, a consultant for NACEDA on this project who was also involved in several of the previous NCCED CDC censuses, noted in his NACEDA summit presentation that the top quartile of largest CBDOs in the report are getting 80 percent of the resources in the field, and the largest 400 organizations (that is, the top 7 percent) account for half of the resources. Those organizations, he said, tended include a lot of larger-scale housing producers; disability services providers that run, for example, networks of group homes; and community action agencies.
Because the size categories were split so they each have an even number of organizations, there is significant diversity within the “large” category—it encompasses organizations with budgets ranging from $3.3 million to $479 million. That means these size categories might not align with on-the-ground perceptions of what makes a “large” organization. At the NACEDA summit, for example, Sarah Stevenson of Portland’s Innovative Housing Inc., which falls into the large category, observed, “We’ve always thought of ourselves as a small CBDO, because we only have 13 staff. So we think we’re tiny.”
Andrew Dumont of the Federal Reserve Bank, speaking at the summit, noted that the large-small skew differs from state to state, even when both are fairly rural. For example, he found that “on one side you have a state like Kentucky, where 37 percent of organizations in the database are in that largest expense quartile and they reported receiving 92 percent of total revenues for CBDOs in Kentucky in 2018. On the other side, in a state like North Dakota, only 9 percent of organizations are in that largest expense quartile and they receive just 36 percent of total revenues in North Dakota in 2018.” Dumont also identified a rural-urban difference in the Midwest, with rural areas having lots of small CBDOs and large CBDOs and very few in the two middle quartiles, but urban areas having almost an equal number of CBDOs across each size category. Dumont was able to make these observations because the dataset that Urban Institute used has been made public, and NACEDA hopes that others will dive into it to find additional insights.
Along with greater financial challenges, the report found that the smallest organizations get a higher proportion of their revenues from earned income than the largest ones, and that they have relatively more months of cash on hand and less debt—possibly because they also tend to own less real estate. Earned income includes government contracts for services, and many observers suggested that was probably the type of earned income these smaller groups have, though the data doesn’t distinguish the source. They also noted that it could be evidence of it taking smaller organizations multiple years to raise funding for projects that will convert cash into other kinds of assets, like buildings, or being conservative about spending when facing very inconsistent revenue.
Many of “our CDC members have told us they are having challenges accessing capital, and often put their own reserves, own resources into projects because it takes too long,” says Seema Agnani, executive director of Coalition for Asian Pacific American Community Development. “In high-cost markets you have to move so quickly. You know a property may come on the market, but it might take years to line up the financing.”
Even if a small organization’s reserves are a high percentage of their expenses, they are still small in dollar amount, noted Lou Tisler, director of the National NeighborWorks Association, and still won’t allow small organizations with very few staff members to “to absorb financial shock as much as a larger organization.”
In his summit opening remarks, NACEDA executive director Frank Woodruff noted that small CBDOs are often led by people of color and in many communities of color may be the only groups serving that neighborhood, and so the disproportionate funding going to larger organizations is concerning.
The takeaway of the financial health findings “should not be ‘let’s just work with the larger CDCs,’” says Agnani. “It’s important to ensure that smaller organizations and newer organizations can enter this work. If we don’t leave room for new CBDOs, how will we change with the times, and meet the moment, particularly with a focus on communities of color and racial equity?”
Woodruff said he hopes that the Grounding Values findings will provide some context for how important all of these CBDOs organizations remain, their economic impacts, and the kinds of support they need.
[Related Article: A New Normal: Nonprofits and the Next Phase of COVID]
“There needs to be additional federal resources for these organizations at the organizational level, to build their capacity to meet local needs,” says Kudlowitz. “In rural communities, or areas of higher relative poverty, that’s even more important because these organizations are really playing an outsized role in assistance provision”—something that became even more clear during the pandemic.
“Here are these organizations that are doing what needs to be done to hold the fabric of the community, to help those that are less fortunate in need,” says Tisler. “I’m hoping that funders and others see that , and that it’s important.”
Grounding Values phase two will provide more detailed information about topics like coverage areas, programs and services provided, and demographics and leadership, based on a survey. If your organization has received a survey from the Urban Institute, the deadline to complete it is Oct. 21. The subject line is “Request to Participate: National Survey of Nonprofit Community Developers.” The survey takes about 30 minutes to complete.


Comments