
As housing and community development practitioners, you need little convincing that dismantling racial barriers to economic opportunity—from policing practices to exclusionary zoning—is critical to building stronger, more cohesive communities.
But what about the economic cost of these persistent racial inequities? Might segregated regions not just undermine the country’s moral fabric, but also hinder its long-term economic success, especially as we bolt toward a more multiracial future?
That’s a line of thinking that we’ve been exploring for the past few years with professor Manuel Pastor and his colleagues at the Program for Environmental and Regional Equity at the University of Southern California (PERE); and we just released a new analysis that adds some numbers to our assertion that “equity is the superior growth model.”
We asked the question: How much higher would total earnings and economic output have been in 2012 if racial differences in income were eliminated and blacks, Latinos, Native Americans, and other communities of color had similar average incomes (and income distributions) as whites?
Our top-line finding: America’s annual GDP would have been $2.1 trillion higher with racial equity—a 14 percent increase. That’s about the size of California’s economy, the eighth largest in the world.
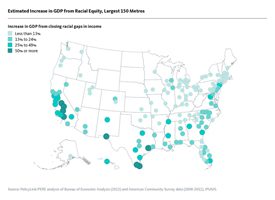
Drilling down to metros, we found even more dramatic potential gains. The country’s largest 150 regions could collectively grow their GDP by 24 percent by addressing racial inequities, compared with the national gain of 14 percent. Los Angeles stands to gain the most: $510 billion per year. But even the smallest potential gain—in Springfield, Missouri where the population is 91 percent white—is still in the hundreds of millions ($287 million).
In other words, the economic return on racial equity is enormous. What’s more, this “equity dividend”—for people, places, and the nation—will only continue to grow as people of color become the majority.
Now, it's important to note that these are estimates. We were conservative in that we did not include the inevitable “multiplier effect” of increasing incomes for people of color. In reality, more money in the pockets of low-wage workers of color would increase local spending, bolster neighborhood businesses, and create jobs. We also did not factor in the costs of moving toward equity. While some strategies to achieve racial economic inclusion—like removing the question about conviction history from job applications—would cost very little, others—like upgrading public education systems—will certainly have a higher price tag, but are smart, strategic investments.
Though these figures are just estimates, they are useful because they start to reveal just how much stronger America’s regions and states would be with equity. For years, advocates, practitioners, and government officials have asked us for a way to quantify the economic benefits of racial equity.
Now, these figures—and a host of other demographic and equity indicators—are available for all states and the largest 150 metros through the National Equity Atlas—a first-of-its-kind data and policy tool for those working to build a more equitable economy. PolicyLink and PERE built the Atlas to provide community leaders and policymakers with the data they need to advocate for the policies and investments to build a new economy that is inclusive, resilient, and prosperous.
What can be done with the Atlas? Here are a few ideas:
- Pull up a quick snapshot of demographic change and equity in your region or state here. Host a community roundtable to discuss demographic change and your community’s economic future using this information, or start with a staff meeting about this topic.
- Access data on your region or state’s housing burden by race, how it changed between 2000 and 2012, and how it ranks here. Download these charts to include in your next conference presentation.
- Find out racial differences in homeownership in your region or state, and whether the racial gap is increasing or decreasing here. Share these charts with your social media followers.
- Help us evolve this living resource. We plan to add more indicators, geographies, displays, and analyses to the Atlas and are on the lookout for indicators that are available at the regional level and can be disaggregated by race/ethnicity. Share your dream indicators with us.
Join us for our launch webinar. On Tuesday, November 18, 3-4 EST, we’ll tour the site and share ideas about how to apply this tool to your work. Please register here.
(Photo courtesy of PolicyLink)


Comments