
Thirty years ago, the Joint Center for Housing Studies (JCHS) published the first of what became its annual State of the Nation’s Housing report. The report highlighted several concerns about housing affordability that remain with us today, including: an inadequate supply of low-cost housing, rising renter cost burdens, housing assistance programs not keeping up with need, and growing obstacles to homeownership.
Although these problems are very familiar to us today, what’s surprising is that by most measures, all of them have gotten significantly worse since 1988. While each annual State of the Nation’s Housing report has documented these changes incrementally, looking back 30 years provides a unique frame of reference for just exactly how much worse housing affordability challenges have become.
Housing Then
In 1988, the report documented concern that the supply of low-cost rental housing was inadequate. Even though there had just been a boom in rental housing construction in the early 1980s, inflation-adjusted contract rents were at their highest point in two decades after having risen 16 percent between 1981 and 1987. Rent growth was most rapid among low- and moderate-rent units, reducing the number of units affordable to low-income renter households.
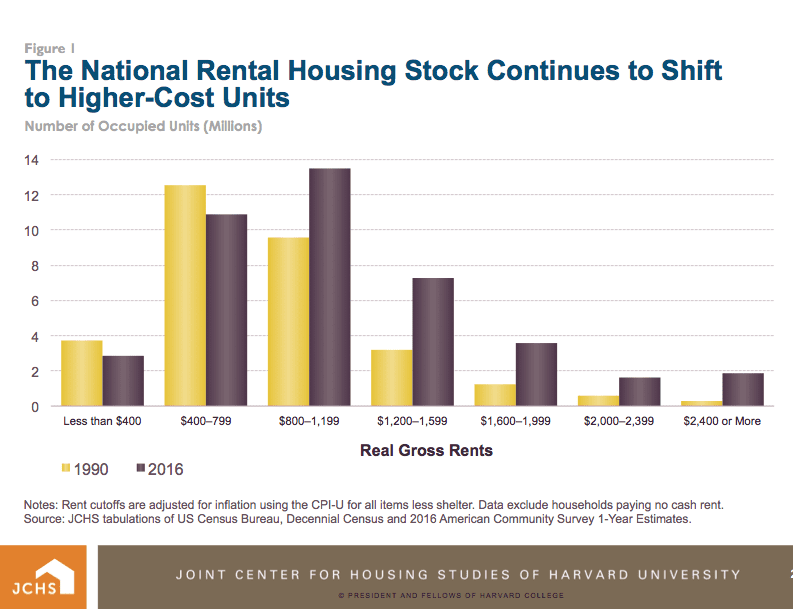 Since 1988, the adequacy of the supply of low-cost rental units has not improved. In fact, the 2018 State of the Nation’s Housing report found that between 1990 and 2016, the number of units renting for under $800 per month dropped by 2.5 million. Meanwhile, the number of renter households earning $32,000 a year or less—and requiring a rent cost of $800 or less per month to avoid being rent burdened—increased by 5 million. We are left with a gap in supply that, according to the latest report from the National Low Income Housing Coalition, amounts to 7.7 million rental units affordable and available to very low-income renters.
Although the standard metric for cost burden, defined as paying more than 30 percent of income for direct housing expenses, was not tracked when the 1988 report was written, the report does note that median gross rents had risen from 23.3 percent of the median renter income in 1974 to 29.7 percent of median renter incomes in 1987, with even sharper increases among younger renters.
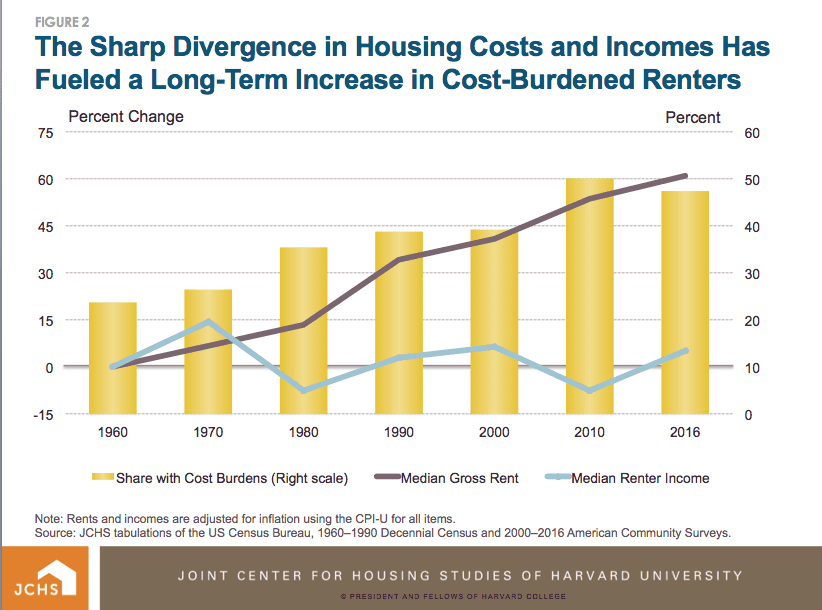 Since that time, renter cost burdens have risen further. As reported in the 2018 State of the Nation’s Housing, the share of renter households paying more than 30 percent of income on rent rose from 38.9 percent in 1990 to 47.5 percent in 2016—nearly 9 percentage points. This significant, long-term growth overshadows the 2.7 percentage point decline in cost burden rates by renters since 2010.
Similarly, in 1988 there was concern that the level of housing assistance was not keeping pace with the growth in households who qualified for it. While the 1988 report described the sharp increase in the number of federally assisted households between 1974 and 1987— which included a 73 percent increase in renters who are receiving rental assistance and a doubling of the proportion of lowest-income renters receiving assistance—it also decried the fact that the increase in assistance levels had “virtually stopped” as of the mid-1980s even as the number of eligible, but unassisted, renter households continued to grow.
Housing Now
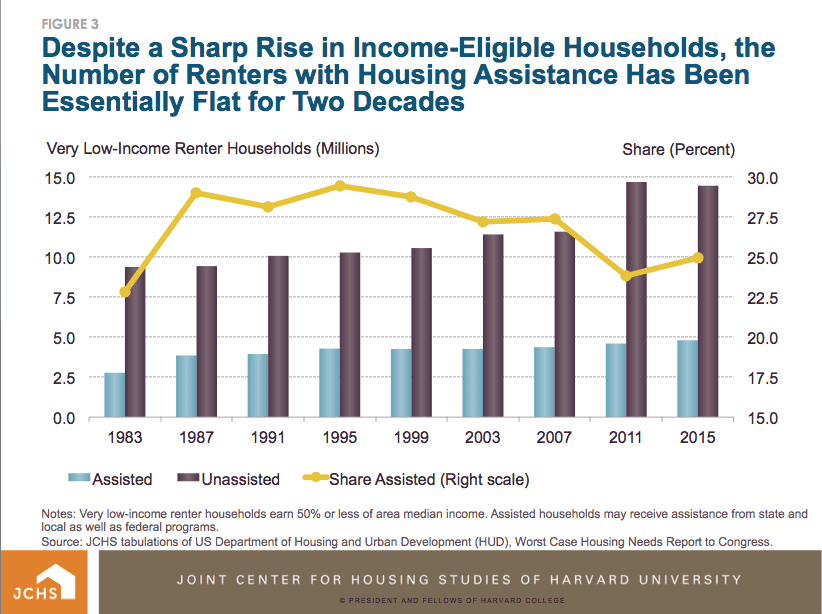 Since 1988, according to a JCHS review of HUD’s Worst Case Housing Needs reports, the number of very low-income renter households that qualify for housing assistance rose by 6 million between 1987 and 2015, while the number of households receiving rental assistance rose by just 950,000. As a result, the share of those households receiving assistance declined from 29 percent in 1987 to roughly 25 percent in 2015.
In addition to renters, the 1988 report expressed concerns about trends in homeownership. At that time, there were signs that access to homeownership was in danger, particularly for first-time homebuyers. Illustratively, between 1980 and 1987, as the overall rate dropped from 65.6 to 64.0, the homeownership rate among 25 to 34 year olds dropped from 52.3 percent to 45.1 percent. Behind this decline was elevated home prices, interest rates, and utility costs that by 1988 had driven homeowner costs up to levels that were well above where they had averaged over the previous 20 years.
Today, an extended decline in homeownership rates has also brought renewed focus on access to homeownership. Indeed, 2018 marked the end of a 12-year drop that, interestingly enough, brought the U.S. homeownership rate back what it was in 1988. With today’s low interest rates, it’s not costs of homeownership as much as it is high prices in many markets, as well as access to credit that have been discussed as the primary barrier. Nonetheless, access to homeownership, particularly for first-time homebuyers remains a significant concern in 2018.
 The concerns raised in 1988 remain valid as homeownership rate among adults aged 25 to 34—which was 45 percent in 1988—stood at 39 percent in 2017, which once again raises concerns about access to homeownership for younger adults.
The parallels between the State of the Nation’s Housing reports, separated by 30 years, show that the overarching concerns in 1988 remain with us today:
- renters facing growing affordability pressures while also encountering greater barriers to homeownership,
- the housing world in danger of being split into housing haves and have-nots, where opportunities to own homes (and use homeownership to build and retain wealth) would increasingly only be available to a shrinking segment of the population, and
- a growing number of cash-strapped low- and moderate-income households struggling to save at all while living paycheck to paycheck.
This is not to say that increased homeownership in and of itself is the answer to wealth inequalities, or that cost burdens are unique to renters. Rather, it underscores that the need to address the affordability challenges faced by growing numbers of low- and moderate-income households is as relevant and even more pressing today as it was 30 years ago.


Comments