
Every once in a while, it's useful to take stock of the big picture numbers and trends that form the backdrop for all of our work.
In the latest issue of Shelterforce, we have an article by Dan McCue of the Joint Center for Housing Studies, who lays out in careful detail how housing cost burdens are growing, by much, and for whom.
One in six households in America—or 20.2 million—spent more than half of their pre-tax household income on housing costs entering 2011, according to the American Community Survey. And despite historically low interest rates and widespread home price declines, the number of households severely burdened by housing continues to rise.
But as we discussed last year, in these times of rising utility and transportation costs, we can't look at housing costs in a vacuum. Helpfully, the Center for Housing Policy put out this fall Losing Ground: The Struggle of Moderate-Income Households to Afford the Rising Costs of Housing and Transportation, which fills in some of that perspective as well. According to CHP:
In the 25 largest metro areas, the report finds that moderate-income households spend an average of 59 percent of their income on housing and transportation. The report finds cost burdens to be highest in the Miami area, where moderate-income households spend 72 percent of their income on housing and transportation. The next highest burdens are in the Riverside-San Bernardino, Calif., area (69 percent), the Tampa area (66 percent), and the Los Angeles area (65 percent).
“If we really want to understand whether housing is affordable, we need to consider housing and transportation costs together,” explains Center for Housing Policy Executive Director Jeffrey Lubell. “Along with utilities, which we include within housing costs, these are the true ‘costs of place,’ and our report shows they have grown much faster than incomes since 2000.”
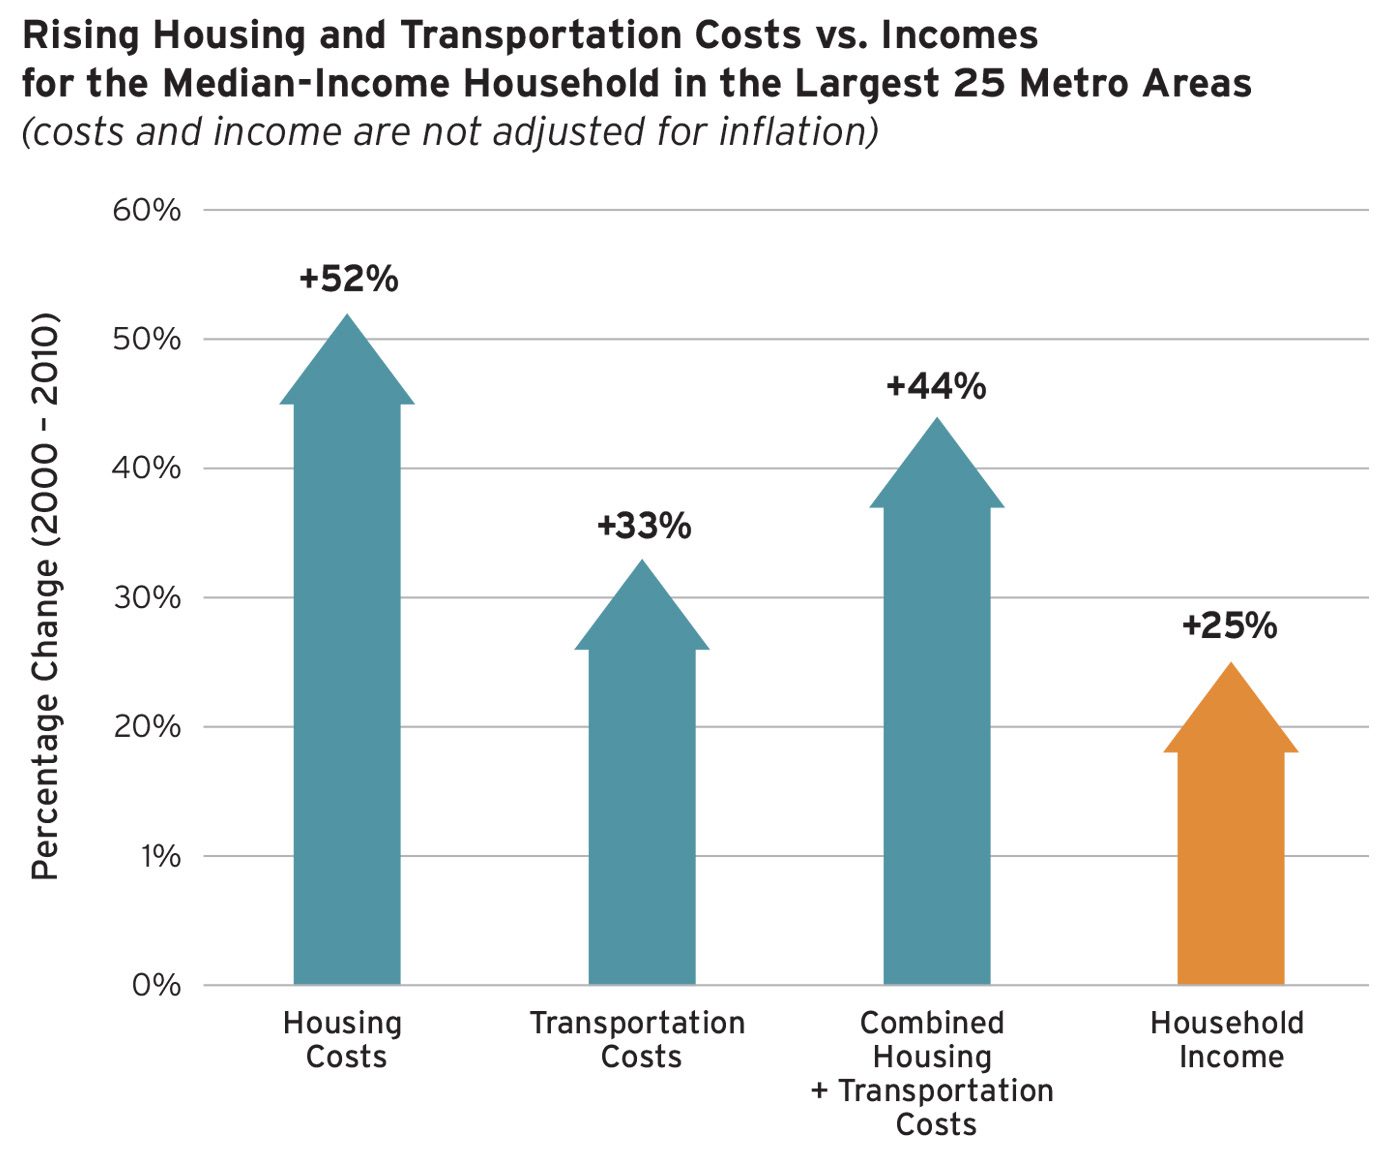
Chart courtesy of CHP.


Comments