

Downtown Los Angeles. Photo by Giuseppe Milo, via flickr, CC BY-NC 2.0
The number of people who pay more than 30 percent of their income on housing is a key metric the Joint Center for Housing Studies (JCHS) and many others use to measure the extent of our housing affordability problem. For example, JCHS’s most recent State of the Nation’s Housing Report noted that the number of cost-burdened renters—those paying more than 30 percent of their income for housing—reached a record high of 21.3 million in 2014.
Such findings often lead to two questions. Where did this metric come from? And is it useful?
The first question is easy to answer. The metrics’ roots date back to at least the late 1800s.
The latter question is more challenging. But while the current 30 percent metric has some flaws, it is still a readily available and arguably more or less accurate gauge of housing affordability.
Why 30 Percent?
Implicit in the use of the 30 percent measure is the assumption that housing should get special consideration in assessing a household’s budget. There are at least two good reasons why this might be the case. Because housing is generally the largest single household expenditure, high housing costs make it hard to pay for other necessities. Moreover, research shows that having a place to live almost always takes precedence over all other expenses. As Matthew Desmond succinctly notes in his best-selling book, Evicted, “The rent eats first.”
But how much is too much? As has been well documented, the 30 percent measure was first a 25 percent measure, derived from an old aphorism that one should devote “a week’s wages to a month’s rent,” which, in turn, was based on studies that go back to at least the late 1800s of what typical families spent on housing. The rule of thumb began to find its way into housing policy beginning in the 1930s both as a measure of need and a guide for how much tenants should be expected to pay for housing. The Brooke Amendment to the Housing and Urban Development Act of 1969 codified 25 percent as the payment standard for public housing. In the 1980s Congress increased this figure to 30 percent for most programs as a budget-cutting measure. Since then, 30 percent has been the norm used to define housing affordability.
Alternative Measures of Affordability
Knowing the history begs the question: should an inflated version of what a typical family spent on housing a century and a half ago be used as a yardstick to gauge affordability today? Since the share of renters exceeding the 30 percent standard has skyrocketed since 2000 (in part because more moderate-income renters exceed this cutoff), should we re-examine whether the well-worn 30 percent standard accurately measures housing affordability?
There are two problems with the assumption that housing costs should not exceed a single fixed percent of income. First, living expenses vary with the number and ages of household members. Second, because the costs of most other necessities do not rise with income, higher-income households can devote a larger share of their income to housing and still be able to afford other needs.
The residual-income approach long championed by the late Michael E. Stone, who was a professor at the University of Massachusetts-Boston, is an alternative metric that addresses these problems. To account for differences in household income and composition, this metric calls for estimating the costs of a given household’s basic necessities and subtracting these costs from the household’s income. The money left over—the residual income—is what’s available to pay for housing. A household that does not have enough to pay for these necessities after paying for housing is considered to be suffering from “shelter poverty.”

Dividing a household’s residual income by its total income produces an income ratio along the lines of the 30 percent metric. However, in this case the ratio will not be a fixed percentage but will vary with the size, composition, and income level of the household. More specifically, the residual-income approach will produce income ratios that are lower for larger households that have to devote more of their income to non-housing expenses, and larger for higher-income households that spend a smaller share of their income on non-housing expenses. The example below shows why.
Comparing the Approaches
To see if the residual-income approach produced noticeably different results from the 30 percent standard, the JCHS used both approaches to assess housing cost burdens in three metropolitan areas that reflect different prevailing rent levels: Los Angeles (high cost), Phoenix (moderate cost), and Cleveland (low cost). We used data from the 2015 American Community Survey to estimate the income and composition of households in these areas (although we limited the analysis to households with no more than four people). We used the Center for Women’s Welfare at the University of Washington’s Self-Sufficiency Standard, which take into account the costs of food, transportation, child care, and other necessities as well as how those costs vary by both county and household composition. In addition, we added our own estimates of federal and state taxes household members would pay in each of these markets, drawing on estimates from the Tax Policy Center of the Urban Institute and the Brookings Institution.
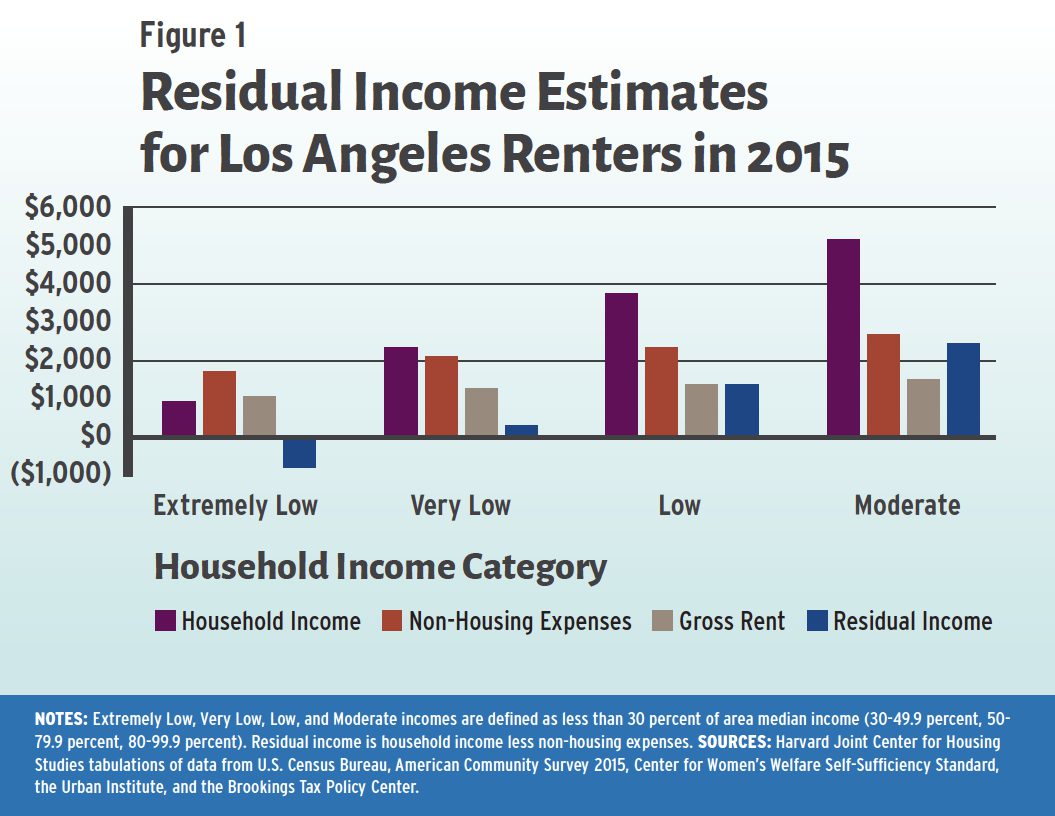
In Los Angeles, among extremely low-income renters, average incomes fell well short of the Self-Sufficiency Standard, meaning that these households needed nearly $800 in support each month to meet their basic needs—even before paying anything for housing (Figure 1). For very low-income renters, average household incomes just covered these non-housing costs, leaving only about $250 (about 10 percent of their total income) to pay for housing each month, well below the median rent of $1,350 in Los Angeles. Among low-income renters, average residual income (which was about 37 percent of their total income) was just enough to cover typical housing costs. For moderate-income renters, residual income (which was about 48 percent of their total income) was generally sufficient to comfortably cover housing costs.
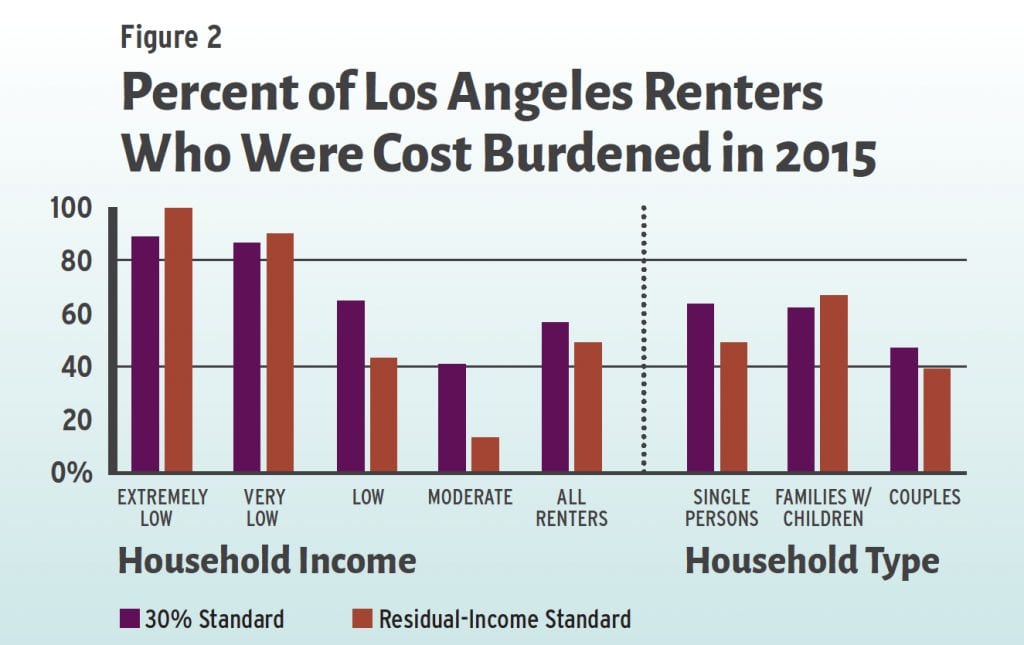
Overall, the residual-income method estimates that 51 percent of all Los Angeles metro renters are cost burdened, meaning they cannot cover their non-housing expenses after paying rent. This compares to 57 percent of renters who are cost burdened using the 30 percent of income standard (Figure 2). This suggests that in a high-cost market like Los Angeles, the standard 30 percent measure may slightly overestimate the cost-burdened share of all renters. But while these estimates are broadly in line with each other, there are some notable differences in the results from the two approaches by household income levels. The residual-income approach produces slightly higher estimates of cost-burdened households for extremely low- and very low-income renters and significantly lower estimates of the share of cost-burdened low- and moderate-income renters.
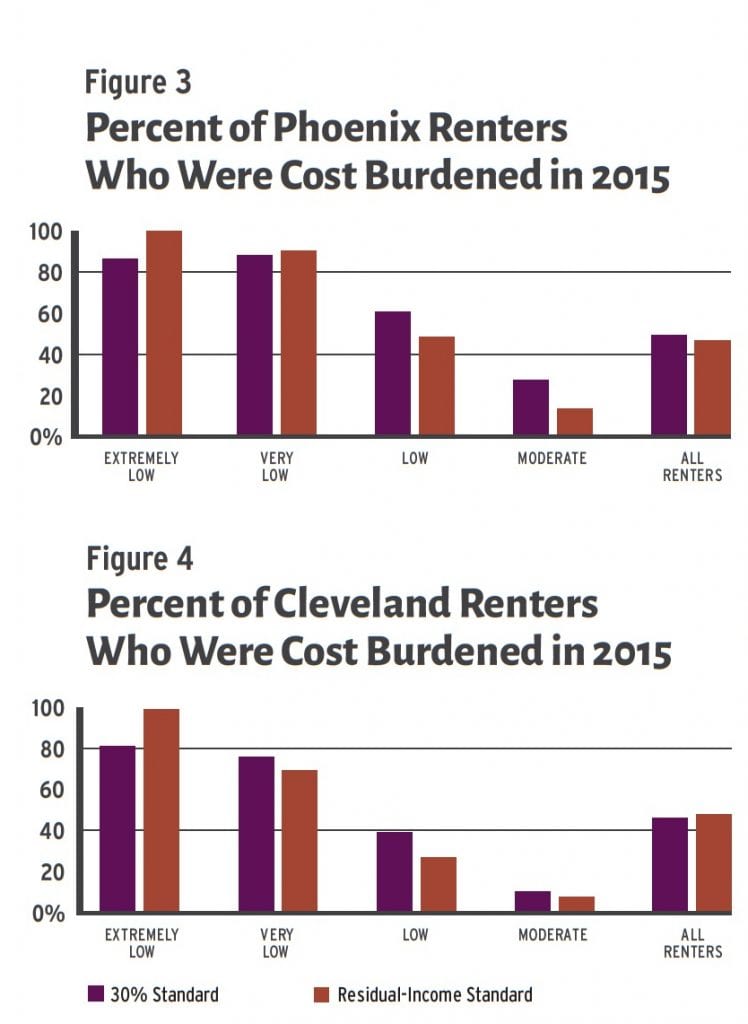
In general, the patterns in the Phoenix and Cleveland metro areas are quite similar to those in Los Angeles. The residual-income approach suggests that nearly all extremely low-income renters are cost burdened in all three markets, compared to about 80 percent under the 30 percent metric. There is also little difference between the two measures for very low-income renters. As in Los Angeles, the residual-income approach produces somewhat lower estimates for the share of low- and moderate-income renters who are cost burdened.
However, the magnitude of the differences between the two approaches for low- and moderate-income renters is smaller in areas with lower market rents (Figures 3 and 4). Both Phoenix and Cleveland have much smaller differences in these shares than high-cost Los Angeles, and in low-cost Cleveland there is almost no difference between the measures for moderate-income renters. In general, the methods yield very similar shares of total renters who are cost burdened in these two markets: just 2 percentage points lower under the residual-income method in Phoenix (47 versus 49 percent) and 2 percentage points higher in Cleveland (48 versus 46 percent).
What’s the Bottom Line?
For the metro areas overall, burden levels from the more precise measures of housing-cost burdens produced by the residual-income approach are not significantly different than those generated by the cruder 30 percent of income metric. The measures do differ in their estimates for specific income groups. The 30 percent metric underestimates cost burdens for the lowest-income households and overstates them for those with higher incomes. In aggregate, these differences only changed the overall rate in the high-cost market of Los Angeles, where, it bears mention, both measures find that more than half the region’s renters are cost burdened, a figure that is slightly higher than the moderate-cost Phoenix and lower-cost Cleveland metro areas.
Using the 30 percent standard also produces biases in estimates of housing cost burdens by household type. Across the three metro areas, the differences in cost-burden shares using the residual-income approach range from 5 to 13 percentage points lower for single persons to 5 to 14 percentage points higher among families with children.
So, is use of the 30 percent of income standard problematic? As with much in life, it depends. In this case, it depends on how the measure is to be used. As a gauge of the overall level of housing affordability for a market, the 30 percent of income standard actually produces estimates that are quite similar to the residual-income approach. Michael Stone’s work, which generated national estimates from 1970 through 2001, shows that the trend over time in these two measures has in fact been quite similar.
But this analysis does suggest that the 30 percent of income standard may overstate the degree of cost burdens in higher-cost markets like Los Angeles where more low- and moderate-income renters exceed this standard. However, even in this case, the overall measure is not that different and still very high.
Perhaps the largest concern is when the measure is used to compare the rate of housing cost burdens across income groups or household types. But here too the differences are just a matter of degree. Under either measure, the vast majority of extremely low-income renters are unable to afford housing in every type of market. However, the residual-income approach puts a spotlight on the particular challenges for low- and moderate-income families with children who face higher costs for child care, food, and health care. The 30 percent standard also inflates the challenges facing moderate-income households generally, which is an important consideration when deciding how to target scarce housing assistance funding.
In the end, the consistency of the 30 percent of income standard, coupled with the simplicity of its calculation, its ready availability over time and for most every geographic areas, and the fact that it produces reasonably accurate measures of affordability means it will remain the go-to benchmark for assessing the overall extent of housing affordability. But because it does not fully measure housing cost burdens, it is important that it not be the only data point used when crafting policy responses that target or affect specific segments of the renter population or focus on different market contexts.


Comments